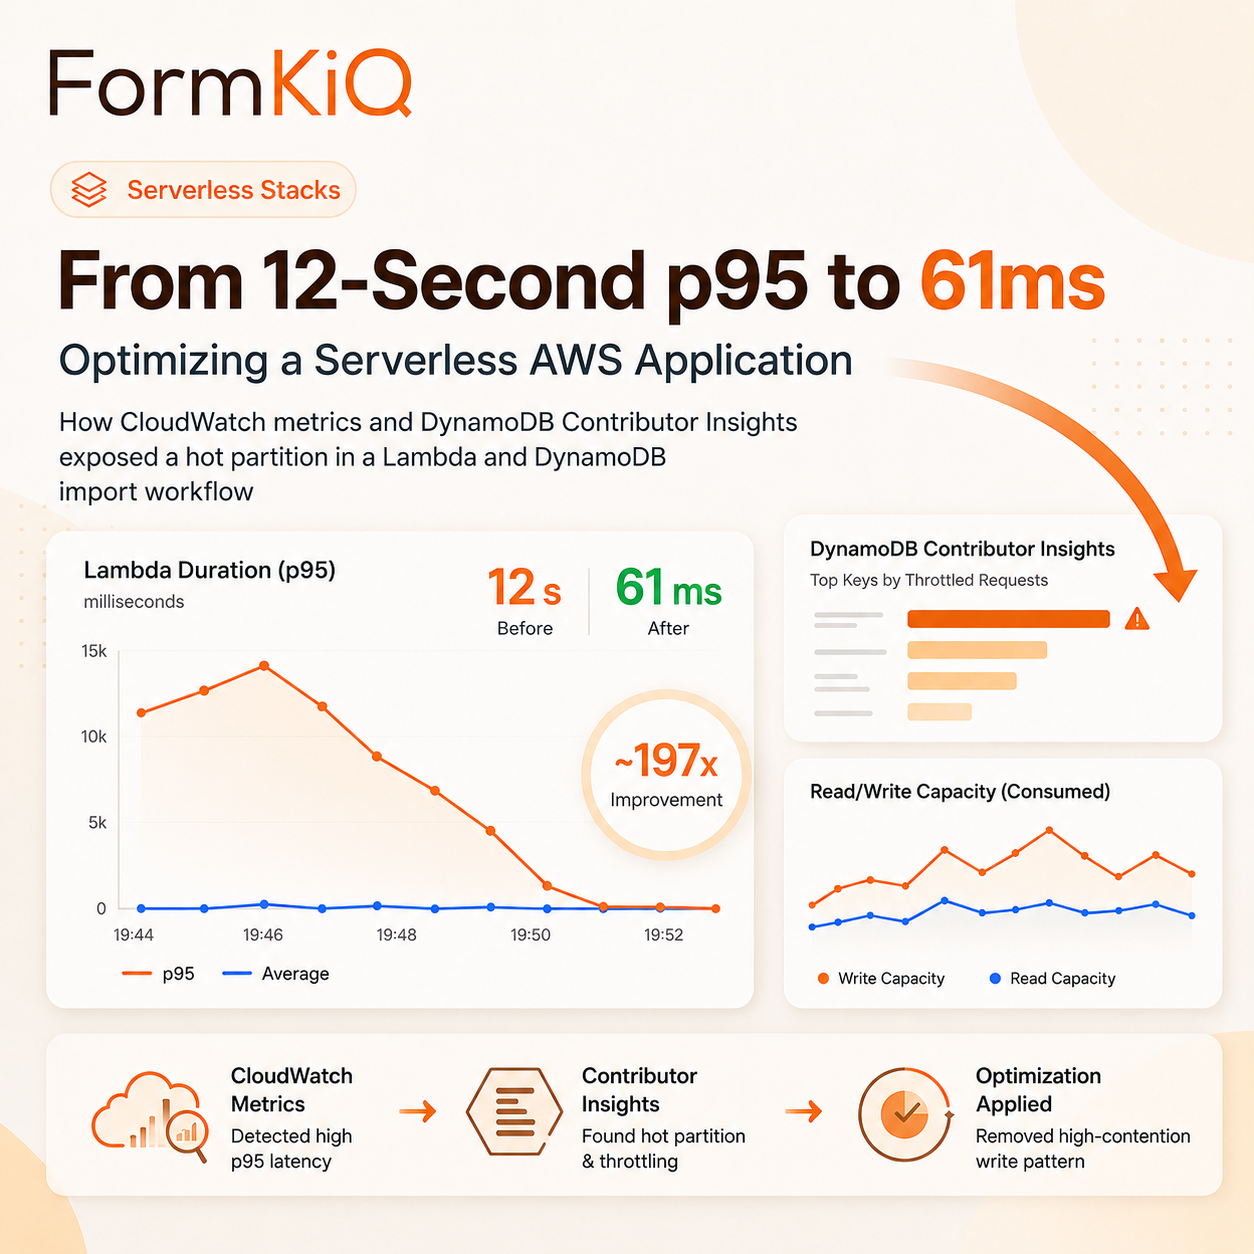
From 12-Second p95 to 61ms: Optimizing a Serverless AWS Application
How CloudWatch metrics and DynamoDB Contributor Insights exposed a hot partition in a Lambda and DynamoDB import workflow

by Mike Friesen
Performance problems are easy to ignore until a real workload exposes them. In this case, the trigger was a customer migration that needed to import very large document collections into FormKiQ. The existing import path worked, but under heavy load it was not fast enough for their needs.
This post walks through how we used Amazon CloudWatch, CloudWatch Logs Insights, and DynamoDB Contributor Insights to find and fix a serverless performance issue in an AWS Lambda and Amazon DynamoDB application. The result was a major reduction in Lambda latency by removing an unnecessary high-contention write pattern.
The Performance Problem
When running imports of 100,000+ documents into the FormKiQ DMS, we saw large pauses during the load test. The larger the batch, the more noticeable the pauses became. It was clear that some kind of contention was happening. The question was where.
FormKiQ uses AWS serverless technologies like AWS Lambda and Amazon DynamoDB. API requests are handled by Lambda, document metadata is stored in DynamoDB, and folder/document listing behavior is supported by partition-key and sort-key index patterns.
That meant the first step was to measure the full request path, not just the Lambda function.
How We Measured It
We collected metrics from both Lambda and DynamoDB during a repeatable document import load test.
For Lambda, we looked at:
- Invocation count:
AWS/LambdaInvocations, usingSum - Maximum concurrent executions:
AWS/LambdaConcurrentExecutions, usingMaximum - Errors:
AWS/LambdaErrors, usingSum - Throttles:
AWS/LambdaThrottles, usingSum - Duration:
AWS/LambdaDuration, usingp95,p99, andMaximum
For DynamoDB, we looked at:
- Write throttle events:
AWS/DynamoDBWriteThrottleEvents, usingSum - Read throttle events:
AWS/DynamoDBReadThrottleEvents, usingSum - Successful request latency:
AWS/DynamoDBSuccessfulRequestLatency, usingAverageandMaximum - Base table behavior versus GSI behavior, using the same throttle and latency metrics grouped by table and global secondary index dimensions
-
Contributor Insights hot keys on the base table, GSI1, and GSI2, including
MaxContributorValue,UniqueContributors,SampleCount, andSum
CloudWatch metrics showed whether the system was slow, throttled, or failing. CloudWatch Logs Insights helped confirm route-level behavior and Lambda duration distribution. DynamoDB Contributor Insights filled in the most important missing piece: which keys were receiving the most concentrated traffic.
This distinction mattered because successful DynamoDB requests were still fast. The issue was not that every DynamoDB call was slow. The issue was that some writes were being throttled or forced through retry/backoff before they could succeed.
What the Metrics Showed
The initial load-test metrics showed a clear tail-latency problem.
| Key number | CloudWatch namespace | Metric | Statistic used | Total |
|---|---|---|---|---|
| Lambda invocations | AWS/Lambda | Invocations | Sum | 100,000 |
| Lambda max concurrency | AWS/Lambda | ConcurrentExecutions | Maximum | 502 |
| Lambda errors | AWS/Lambda | Errors | Sum | 0 |
| Lambda throttles | AWS/Lambda | Throttles | Sum | 0 |
| Lambda p95 duration | AWS/Lambda | Duration | p95 | 12,053 ms |
| Lambda p99 duration | AWS/Lambda | Duration | p99 | 12,521 ms |
| Lambda max duration | AWS/Lambda | Duration | Maximum | 48,390 ms |
| DynamoDB write throttles | AWS/DynamoDB | WriteThrottleEvents | Sum | 24,807 |
| DynamoDB read throttles | AWS/DynamoDB | ReadThrottleEvents | Sum | 0 |
A few details stand out. Lambda itself was not being throttled. Lambda errors were also zero. But Lambda p95 was over 12 seconds, p99 was also over 12 seconds, and the slowest invocation took more than 48 seconds.
At the same time, DynamoDB recorded 24,807 write throttle events. That pointed away from Lambda CPU, memory, cold starts, or handler code as the primary bottleneck. The more likely explanation was that Lambda was waiting through DynamoDB retries and backoff after write throttling.


Finding the Hot DynamoDB Partition
Table-level DynamoDB metrics told us there were write throttles, but they did not explain which access pattern caused them. DynamoDB Contributor Insights made that visible.
We enabled Contributor Insights for the base table and the relevant GSIs. The base table showed hot contributors, while GSI1 and GSI2 did not show dominant throttled keys.
| Insight rule | Scope | Key labels | Top contributor / hot key | Metric | Value |
|---|---|---|---|---|---|
| DynamoDBContributorInsights-PKC-formkiq-core-dev-documents | Base table | PK | global#folders#d8592cb2-7dfc-4e18-ad35-84bdd2785000 |
MaxContributorValue | High |
| DynamoDBContributorInsights-PKC-formkiq-core-dev-documents | Base table | PK | global#folders#d8592cb2-7dfc-4e18-ad35-84bdd2785000 |
WriteThrottleEvents / throttled contribution | High |
| DynamoDBContributorInsights-SKC-formkiq-core-dev-documents | Base table | PK, SK | global#folders#d8592cb2-7dfc-4e18-ad35-84bdd2785000 / ff#batch-000443 |
TopContributor | High |
| DynamoDBContributorInsights-SKC-formkiq-core-dev-documents | Base table | PK, SK | global#folders#d8592cb2-7dfc-4e18-ad35-84bdd2785000 / ff#batch-000413 |
TopContributor | High |
| DynamoDBContributorInsights-GSI1-formkiq-core-dev-documents | GSI1 | GSI keys | No dominant throttled key | Throttles | 0 |
| DynamoDBContributorInsights-GSI2-formkiq-core-dev-documents | GSI2 | GSI keys | No dominant throttled key | Throttles | 0 |
The hot key pattern pointed to the folder index. FormKiQ stores folder listing records under keys like global#folders#<folder_id>, with child entries represented by sort keys
such as ff#batch-000443.
That was an important clue. The bottleneck was not a single document record. It was many concurrent operations concentrating writes under the same logical folder partition.
To confirm that, we mapped the reported keys back to application paths. For example, global#folders#d8592cb2-7dfc-4e18-ad35-84bdd2785000 mapped to
/docs/import-20260611T192455Z, and hot sort keys like ff#batch-000443 mapped to child folder/index entries under that same import path. That confirmed the load test was
creating many child records under one parent folder.
Contributor Insights also helped separate two different contention patterns:
- Sort keys ending in
.lockpointed to lock acquisition contention. - Sort keys like
ff#batch-000443pointed to actual folder index row writes.
In this case, the hot contributors centered on the folder index pattern, so the next step was to look at the code that updated folder index records and parent folder metadata.
Root Cause
When a document was added, FormKiQ did not only create the document metadata and folder index row. It also updated the parent folder's LastModifiedDate.
That is reasonable during normal traffic. Users expect the parent folder to reflect recent changes. Under this load test, however, many concurrent Lambda invocations were adding documents under the same parent folder. Each one also tried to update the same parent folder metadata.
That created unnecessary write pressure against the same logical partition. DynamoDB throttled those writes, and Lambda invocations waited through retry/backoff. The result was high p95 and p99 latency even though Lambda itself had zero errors and zero throttles.
The Optimization
The fix was to make parent folder LastModifiedDate updates less aggressive.
Instead of updating the parent folder metadata for every document update under load, the code now checks the parent's current LastModifiedDate and avoids unnecessary repeated writes
when the timestamp is already recent enough. In practice, the same parent folder timestamp is updated at most once per 60 seconds. This preserves useful folder freshness while removing repeated
writes to the same hot item/index pattern.
The important point is that the fix was not more Lambda memory, more retries, or more table-level capacity. The breakthrough came from reducing write amplification in the application access pattern.
Final Results
After the change, a later 100,000-document import run produced a much cleaner load profile: no Lambda errors, no Lambda throttles, no DynamoDB read or write throttles, and dramatically lower Lambda tail latency.
| Key number | CloudWatch namespace | Metric | Statistic used | Total |
|---|---|---|---|---|
| Lambda invocations | AWS/Lambda | Invocations | Sum | 100,000 |
| Lambda max concurrency | AWS/Lambda | ConcurrentExecutions | Maximum | 204 |
| Lambda errors | AWS/Lambda | Errors | Sum | 0 |
| Lambda throttles | AWS/Lambda | Throttles | Sum | 0 |
| Lambda p95 duration | AWS/Lambda | Duration | p95 | 61.23 ms |
| Lambda p99 duration | AWS/Lambda | Duration | p99 | 74.50 ms |
| DynamoDB write throttles | AWS/DynamoDB | WriteThrottleEvents | Sum | 0 |
| DynamoDB read throttles | AWS/DynamoDB | ReadThrottleEvents | Sum | 0 |
The p95 duration dropped from 12,053 ms to 61.23 ms, roughly a 197x improvement for this measured run. DynamoDB write throttles dropped from 24,807 to zero.
One caveat is worth calling out: the optimized run had lower peak Lambda concurrency than the original problem run. That means the right validation path is to keep repeating the load test at comparable concurrency levels. Still, the before/after metrics show the core bottleneck clearly: once the high-contention parent-folder write pattern was removed, DynamoDB throttling disappeared and Lambda tail latency collapsed.
Takeaways
For AWS serverless performance work, the most useful lesson is that Lambda latency can be caused by downstream service contention. Zero Lambda errors and zero Lambda throttles do not necessarily mean the request path is healthy.
The process that made the issue visible was:
- Measure Lambda duration, errors, throttles, and concurrency.
- Measure DynamoDB read/write throttles and successful request latency.
- Compare base table metrics against GSI metrics.
- Enable DynamoDB Contributor Insights to identify hot keys.
- Map hot keys back to real application access patterns.
- Look for repeated writes to shared parent records, counters, timestamps, or indexes.
- Re-run the same load test and compare p95, p99, max duration, and throttles.
In this case, the fix came from understanding where concurrency concentrated. Reducing one unnecessary metadata update pattern removed DynamoDB throttling and turned a 12-second p95 into a 61ms p95.